![]()
![]()
![]()
![]()
![]()
![]()
![]()
Using Photon
Installation
For the moment, the only way to use Photon is to download the source code from the Github repository (https://github.com/astrom-tom/Photon - using the ‘clone or download’ button and download as zip). To make it work you have to use python 3.6 with the following library and versions:
- PyQt5 v5.10.1: The is for the graphical interface
- Matplotlib v2.2.2: This is for the plotting area.
- Numpy v1.14.2: catalog handling
- Scipy v1.0.1: Some usefull function for smoothing / images
- fitsio v0.9.10: Fits file handling library
Unless python3.6 is your main python, you have to edit one source file: ‘src/photon’. This file is the main source code of photon and begin with the shebang: a line starting with ‘#!’ followed by the path of the python to use. This allows to not have to type ‘python’ each time. Change this path accordingly to your python3.6 path. Once done you can add the src directory to your path and start using it! Go to the next section to learn how to use it!
The help
You start photon from a terminal. The program comes with a help that you can display in your terminal using the help command. Use it like this:
[user@machine]$ photon - -help
This command will display the help of the program:
1 2 3 4 5 6 7 8 9 10 11 12 13 14 15 16 17 18 | Photon V0.1, R. Thomas, 2018, ESO, This program comes with ABSOLUTELY NO WARRANTY;
and is distributed under the GPLv3.0 Licence terms.See the version of this Licence
distributed along this code for details.
positional arguments:
file Your catalog of data to visualize, this is mandatory
(positionnal argument)
optional arguments:
-h, --help show this help message and exit
-t, --header To be used If a header is present in the catalog (#A B
C D....), you just write '-t'. If you do not use it,
each column will be renames colX where X is the number
of the column (starting at 1).
-c CONF, --conf CONF Properties configuration file. If none is givenm the
default configuration will be loaded
-w WIDTH, --width WIDTH
Width of the GUI, default = 780
|
In details it means:
Photon must come with a file as first argument. This file is mandatory. If you do not give it Photon will complain (you can see below for the format of the file you can provide photon with).
Three other OPTIONALS arguments can be used:
- -t: if each column of your file as a header (e.g. a string at the top with the name of the column) you can ask Photon to read it using this argument. If you do not use it, the name of the columns will be col1, col2, ….coli…,colN.
- -c +configuration file: If you saved a customization configuration previously you can load it using this argument and giving the cuztomization configuration.
- -w +width of the window: The GUI is not resizable. Which means that the size of the plot is pre-fedined. By default the width of the window is sized at 780. Using this option, (e.g. -w 1080) will resize the GUI with a width of 1080.
Input file format
For the current version Photon accept only ascii catalogs of columns and fits image. Some precisions:
- The catalog must contain at least 2 columns and 2 lines.
- Each line must contain the same number of column.
- If your catalog starts with a header the header must start with a hash ‘#’ and each column must be named.
- When plotting images, The fits handling library that is used in Photon is called ‘fistio’. Your image must contain only one table for the image. The fitsio command that is used is ‘fistio.read(image.fits)’.
The Graphical User Interface
When starting Photon, the graphical interface shows up in the screen (Screenshot below).
It is composed of five area:
- The plotting Area, where the plot will be displayed.
- The matplotlib toolbar. Allows you to zoom in/out, select specific part of the plot, etc…
- The ‘Add element in plot’ button. It is the button you will use to add elements in the plot such as Line plot, Scatter plot, histograms, strips, text, etc…
- Graphical Elements Panel. Then you click in the previous button, the widgets for the graphical elements you want to use will be displayed in that area. The widgets depend on the type of element you want to add into the plot. (Available elements)
- Customization Panel. This Panel remains the same all the time and help you to customize graphical properties of the plot itself such as: background color, axis tickness or color, ticks label size, fontsizes, etc. (Available Graphical customization)
When clicking on ‘Add element in plot’ you have these different choices:
- line
- line / new file
- scatter
- scatter /new file
- histogram
- histogram /new file
- Error
- Error / new file
- Straight line
- Span
- Text
- Image
- Image / new file
All the plotting elements are described here: Available elements. As you can see some plotting elements are repeated (e.g. ‘line’ and ‘line / new file’). As you start Photon with a particular file it can be useful to be able to load data from another file. If this is the case you can use ‘XX / new file’ and Photon will open dialog window to choose another file to use in photon.
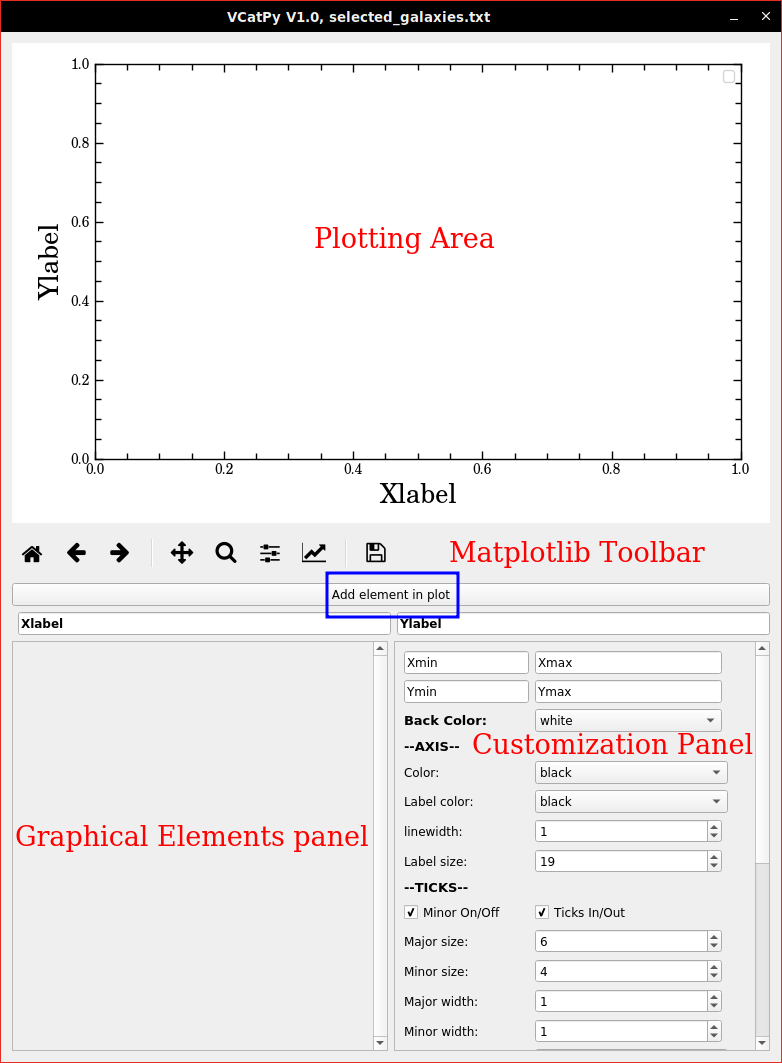
Fig2: GUI of Photon